JL_Cockpit.jl
  • Home
    • Index of all functions
  • Getting Started
  • Tutorials
    • Customising the Training
    • Using the Visualiser standalone
  • API Reference
    • Training and Visualisation API
    • Plot Functions
    • Utils
  • Internal Functions
Version
  • Home
  • Home
GitHub

JL_Cockpit

A visualisation of metrics during a Flux.jl training loop.
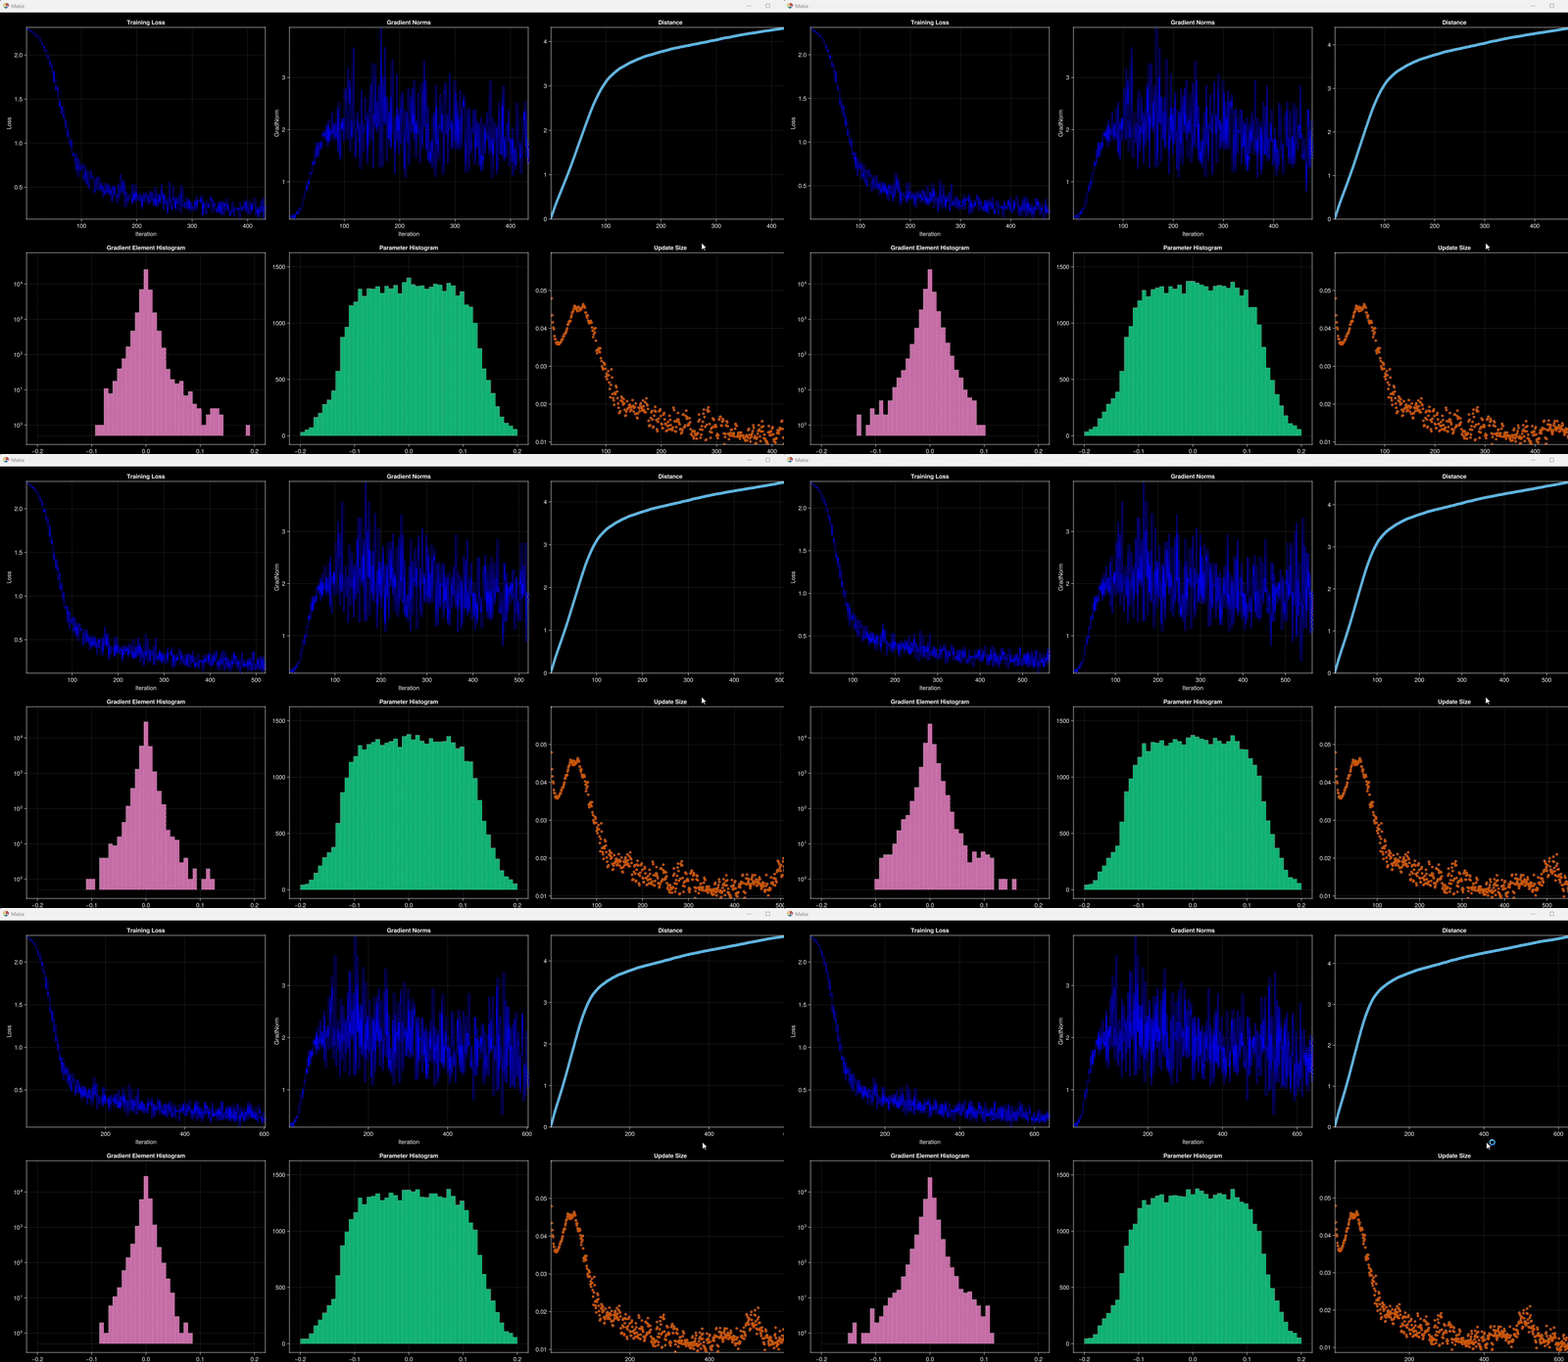
Training Visualisation

Index of all functions

  • JL_Cockpit.Datapoint
  • Base.append!
  • Base.push!
  • Base.push!
  • JL_Cockpit.distance_plot!
  • JL_Cockpit.grad_norm_plot!
  • JL_Cockpit.hist_1d_plot!
  • JL_Cockpit.hist_2d_plot!
  • JL_Cockpit.iterate_plot_pos
  • JL_Cockpit.loss_plot!
  • JL_Cockpit.params_plot!
  • JL_Cockpit.preprocess
  • JL_Cockpit.training_loop
  • JL_Cockpit.update_size_plot!
  • JL_Cockpit.visualiser
Getting Started »

Powered by Documenter.jl and the Julia Programming Language.

Settings


This document was generated with Documenter.jl version 1.11.4 on Friday 11 July 2025. Using Julia version 1.11.6.